Introduction to feature extraction
![]()
[1]:
import vbi
import numpy as np
import matplotlib.pyplot as plt
from vbi import report_cfg
from vbi import extract_features_df, extract_features_list
from vbi import get_features_by_domain, get_features_by_given_names
[2]:
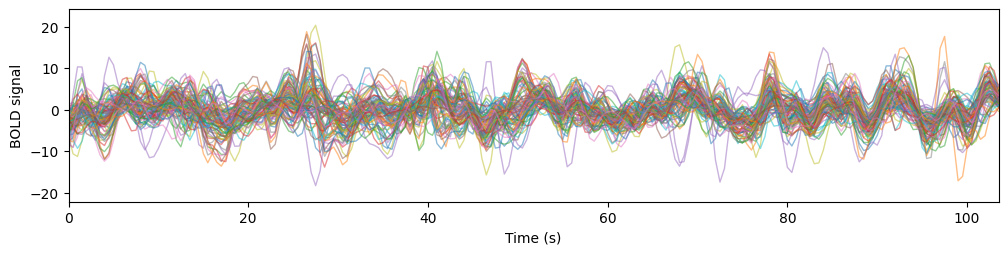
D = vbi.LoadSample(nn=88)
ts = D.get_bold()
print(ts.shape)

plt.figure(figsize=(12,2.5))
plt.plot(np.arange(ts.shape[1])*0.5, ts.T, lw=1, alpha=0.5);
plt.margins(0, 0.1)
plt.xlabel("Time (s)")
plt.ylabel("BOLD signal");
(88, 208)
[3]:
cfg = get_features_by_domain(domain="connectivity")
cfg = get_features_by_given_names(cfg, ['fc_stat'])
cfg = vbi.update_cfg(cfg, 'fc_stat', {"features":["sum"], "fc_function":"corrcoef"})
report_cfg(cfg)
Selected features:
------------------
■ Domain: connectivity
 ▢ Function:  fc_stat
   ▫ description:  Extracts features from functional connectivity (FC).
   ▫ function   :  vbi.feature_extraction.features.fc_stat
   ▫ parameters :  {'k': 0, 'masks': None, 'positive': False, 'verbose': False, 'eigenvalues': True, 'pca_num_components': 3, 'fc_function': 'corrcoef', 'quantiles': [0.05, 0.25, 0.5, 0.75, 0.95], 'features': ['sum']}
   ▫ tag        :  all
   ▫ use        :  yes
[4]:
data = extract_features_list([ts], 0.5, cfg)
data
  0%|          | 0/1 [00:00<?, ?it/s]
100%|██████████| 1/1 [00:00<00:00, 157.36it/s]
[4]:
([array([-5.5172849e-02,  1.8978356e-01,  3.6331561e-01,  5.4156488e-01,
          7.6214993e-01, -8.8817842e-15,  1.0000000e+00,  1.3969272e+03,
          2.9416184e+03], dtype=float32)],
 ['fc_full_quantile_0.05',
  'fc_full_quantile_0.25',
  'fc_full_quantile_0.5',
  'fc_full_quantile_0.75',
  'fc_full_quantile_0.95',
  'fc_full_pca_sum',
  'fc_full_eig_sum',
  'fc_full_ut_sum',
  'fc_full_sum'])
[5]:
data = extract_features_df([ts, ts], 0.5, cfg, n_workers=2)
data
  0%|          | 0/2 [00:00<?, ?it/s]
100%|██████████| 2/2 [00:00<00:00, 172.80it/s]
[5]:
| fc_full_quantile_0.05 | fc_full_quantile_0.25 | fc_full_quantile_0.5 | fc_full_quantile_0.75 | fc_full_quantile_0.95 | fc_full_pca_sum | fc_full_eig_sum | fc_full_ut_sum | fc_full_sum | |
|---|---|---|---|---|---|---|---|---|---|
| 0 | -0.055173 | 0.189784 | 0.363316 | 0.541565 | 0.76215 | -8.881784e-15 | 1.0 | 1396.927246 | 2941.618408 |
| 1 | -0.055173 | 0.189784 | 0.363316 | 0.541565 | 0.76215 | -8.881784e-15 | 1.0 | 1396.927246 | 2941.618408 |
Add custom features
[6]:
from vbi import add_features_from_json
import my_features

cfg = add_features_from_json("my_features.json", my_features)
report_cfg(cfg)
Selected features:
------------------
■ Domain: statistical
 ▢ Function:  mean
   ▫ description:
   ▫ function   :  mean
   ▫ parameters :  {'arg1': 1.0, 'arg2': 2.0}
   ▫ tag        :  all
   ▫ use        :  yes
 ▢ Function:  std
   ▫ description:
   ▫ function   :  std
   ▫ parameters :  {'arg1': 1.0, 'arg2': 2.0}
   ▫ tag        :  all
   ▫ use        :  yes
[7]:
data = extract_features_df([ts, ts], 0.5, cfg, n_workers=2)
data
  0%|          | 0/2 [00:00<?, ?it/s]
100%|██████████| 2/2 [00:00<00:00, 190.50it/s]
[7]:
| m_0 | m_1 | m_2 | m_3 | m_4 | m_5 | m_6 | m_7 | m_8 | m_9 | ... | s_78 | s_79 | s_80 | s_81 | s_82 | s_83 | s_84 | s_85 | s_86 | s_87 | |
|---|---|---|---|---|---|---|---|---|---|---|---|---|---|---|---|---|---|---|---|---|---|
| 0 | 0.017111 | 0.009509 | 0.029611 | 0.006994 | 0.025506 | 0.029548 | 0.029585 | -0.01176 | -0.039832 | 0.018644 | ... | 3.790679 | 3.203614 | 2.421138 | 2.160106 | 4.565415 | 3.082228 | 3.249217 | 1.872746 | 3.495425 | 1.700081 |
| 1 | 0.017111 | 0.009509 | 0.029611 | 0.006994 | 0.025506 | 0.029548 | 0.029585 | -0.01176 | -0.039832 | 0.018644 | ... | 3.790679 | 3.203614 | 2.421138 | 2.160106 | 4.565415 | 3.082228 | 3.249217 | 1.872746 | 3.495425 | 1.700081 |
2 rows × 176 columns
[ ]: