Damped Oscillator - C++
![]()
[1]:
import torch
import pickle
import numpy as np
import sbi.utils as utils
import matplotlib.pyplot as plt
from multiprocessing import Pool
from sbi.analysis import pairplot
from vbi.inference import Inference
from sklearn.preprocessing import StandardScaler
from vbi.models.cpp.damp_oscillator import DO_cpp
[2]:
from vbi import report_cfg
from vbi import extract_features
from vbi import get_features_by_domain, get_features_by_given_names
[3]:
seed = 2
np.random.seed(seed)
torch.manual_seed(seed);
[4]:
parameters = {
    "a": 0.1,
    "b": 0.05,
    "dt": 0.01,
    "t_start": 0,
    "method": "rk4",
    "t_end": 100.0,
    "t_transition": 20,
    "output": "output",
    "initial_state": [0.5, 1.0],
}
[5]:
ode = DO_cpp(parameters)
print(ode())
Damp Oscillator model
{'a': 0.1, 'b': 0.05, 'dt': 0.01, 't_start': 0, 'method': 'rk4', 't_end': 100.0, 't_transition': 20, 'output': 'output', 'initial_state': [0.5, 1.0]}
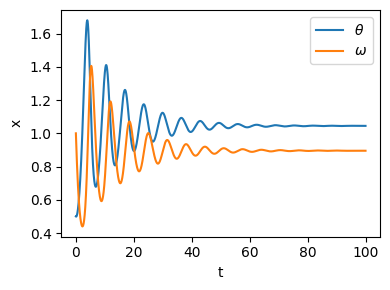
[6]:
sol = ode.run()
t = sol["t"]
x = sol["x"]
plt.figure(figsize=(4, 3))
plt.plot(t, x[:, 0], label="$\\theta$")
plt.plot(t, x[:, 1], label="$\omega$")
plt.xlabel("t")
plt.ylabel("x")
plt.legend()
plt.tight_layout()
plt.savefig("output/damp_oscillator_ts.jpeg", dpi=300)
[7]:
cfg = get_features_by_domain(domain="statistical")
cfg = get_features_by_given_names(cfg, names=["calc_std", "calc_mean"])
report_cfg(cfg)
Selected features:
------------------
■ Domain: statistical
 ▢ Function:  calc_std
   ▫ description:  Computes the standard deviation of the signal.
   ▫ function   :  vbi.feature_extraction.features.calc_std
   ▫ parameters :  {'indices': None, 'verbose': False}
   ▫ tag        :  all
   ▫ use        :  yes
 ▢ Function:  calc_mean
   ▫ description:  Computes the mean of the signal.
   ▫ function   :  vbi.feature_extraction.features.calc_mean
   ▫ parameters :  {'indices': None, 'verbose': False}
   ▫ tag        :  all
   ▫ use        :  yes
[8]:
def wrapper(par, control, cfg, verbose=False):
    ode = DO_cpp(par)
    sol = ode.run(control)

    # extract features
    fs = 1.0 / par["dt"] * 1000  # [Hz]
    stat_vec = extract_features(
        ts=[sol["x"].T], cfg=cfg, fs=fs, n_workers=1, verbose=verbose
    ).values
    return stat_vec[0]
[9]:
def batch_run(par, control_list, cfg, n_workers=1):
    stat_vec = []
    with Pool(processes=n_workers) as pool:
        stat_vec = pool.starmap(
            wrapper, [(par, control, cfg) for control in control_list]
        )
    return stat_vec
[10]:
control = {"a": 0.11, "b": 0.06}
x_ = wrapper(parameters, control, cfg)
print(x_)
[0.12421611 0.10675827 1.0513536 0.8769057 ]
[11]:
num_sim = 2000
num_workers = 10
a_min, a_max = 0.0, 1.0
b_min, b_max = 0.0, 1.0
prior_min = [a_min, b_min]
prior_max = [a_max, b_max]
theta_true = {"a": 0.1, "b": 0.05}
[12]:
prior = utils.torchutils.BoxUniform(
    low=torch.as_tensor(prior_min), high=torch.as_tensor(prior_max)
)
[13]:
obj = Inference()
theta = obj.sample_prior(prior, num_sim)
theta_np = theta.numpy().astype(float)
control_list = [{"a": theta_np[i, 0], "b": theta_np[i, 1]} for i in range(num_sim)]
[14]:
stat_vec = batch_run(parameters, control_list, cfg, n_workers=4)
[15]:
scaler = StandardScaler()
stat_vec_st = scaler.fit_transform(np.array(stat_vec))
stat_vec_st = torch.tensor(stat_vec_st, dtype=torch.float32)
torch.save(theta, "output/theta.pt")
torch.save(stat_vec_st, "output/stat_vec_st.pt")
[16]:
theta.shape, stat_vec_st.shape
[16]:
(torch.Size([2000, 2]), torch.Size([2000, 4]))
[17]:
posterior = obj.train(theta, stat_vec_st, prior, method="SNPE", density_estimator="maf", num_threads=4)
Neural network successfully converged after 297 epochs.train Done in 0 hours 0 minutes 40.652620 seconds
[18]:
with open("output/posterior.pkl", "wb") as f:
    pickle.dump(posterior, f)
[19]:
# with open("output/posterior.pkl", "rb") as f:
#     posterior = pickle.load(f)
[20]:
xo = wrapper(parameters, theta_true, cfg)
xo_st = scaler.transform(xo.reshape(1, -1))
[21]:
samples = obj.sample_posterior(xo_st, 10000, posterior)
torch.save(samples, "output/samples.pt")
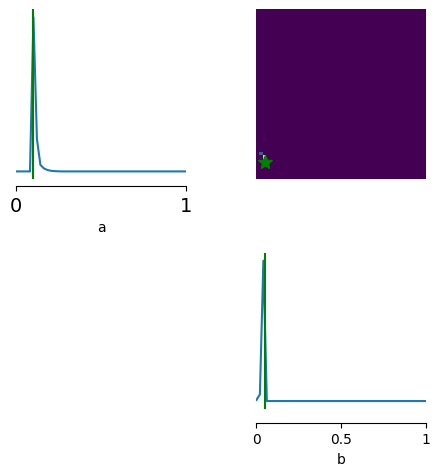
[22]:
limits = [[i, j] for i, j in zip(prior_min, prior_max)]
fig, ax = pairplot(
    samples,
    points=[list(theta_true.values())],
    figsize=(5, 5),
    limits=limits,
    labels=["a", "b"],
    upper="kde",
    diag="kde",
    fig_kwargs=dict(
        points_offdiag=dict(marker="*", markersize=10),
        points_colors=["g"],
    ),
)
ax[0, 0].tick_params(labelsize=14)
ax[0, 0].margins(y=0)
plt.tight_layout()
plt.savefig("output/do_cpp.jpeg", dpi=100)
[ ]: